Met office shows how the climate in Bulgaria has warmed over the past half century

In a social media post, the National Institute of Meteorology and Hydrology showed how temperatures have been rising in Bulgaria for the past 50 years.
Wednesday, June 21, in addition to the start of summer, it is also #ShowYourStripes day.
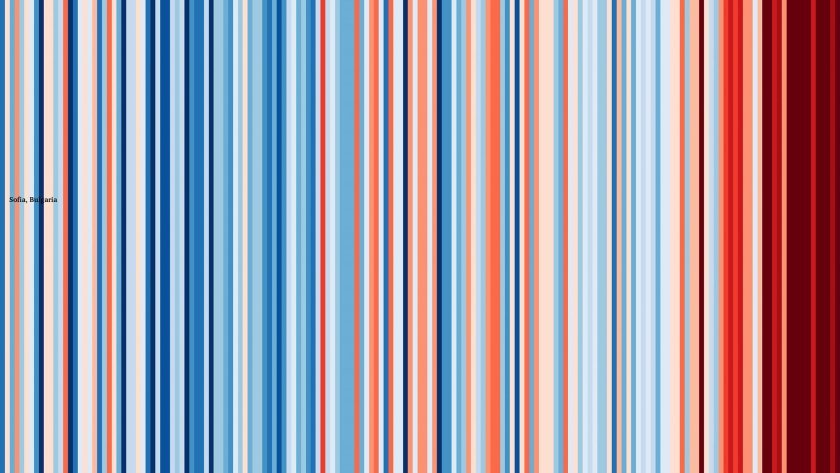
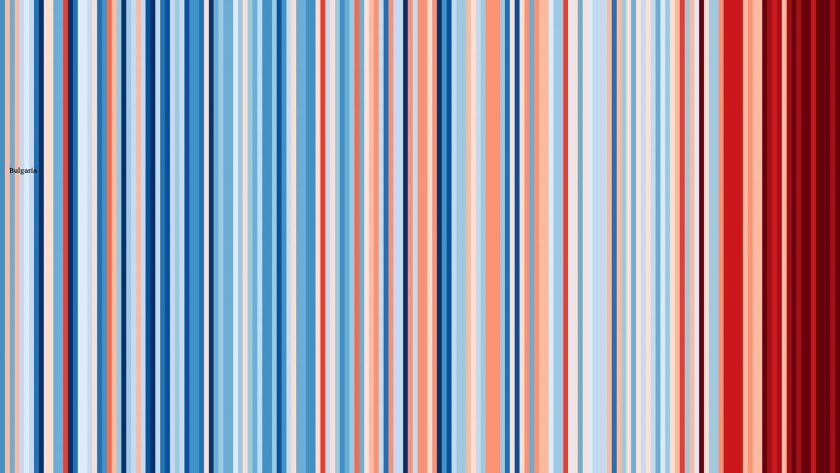
The graphs show the Climate Stripes (temperature electronic blanket) for Bulgaria and Sofia from #ERA5, 1950-2022.
Each stripe represents the average temperature for one year relative to the average temperature for the period as a whole. Shades of blue indicate years that were cooler than normal, while red indicates years that were hotter than normal.
The darker red the stripes on the graph are, the greater the deviation from the norm, the darker blue the stripes are, the colder the year was in comparison with the norm for the relevant year.
Climate stripes for Sofia in the period 1950-2022:

Climate stripes for Bulgaria in the period 1950-2022:

Get the latest news wherever you are!
Follow us on
Facebook
and
Instagram
Follow BNT’s YouTube channel
You can now also watch us on
TikTok
Find us on
Google News


